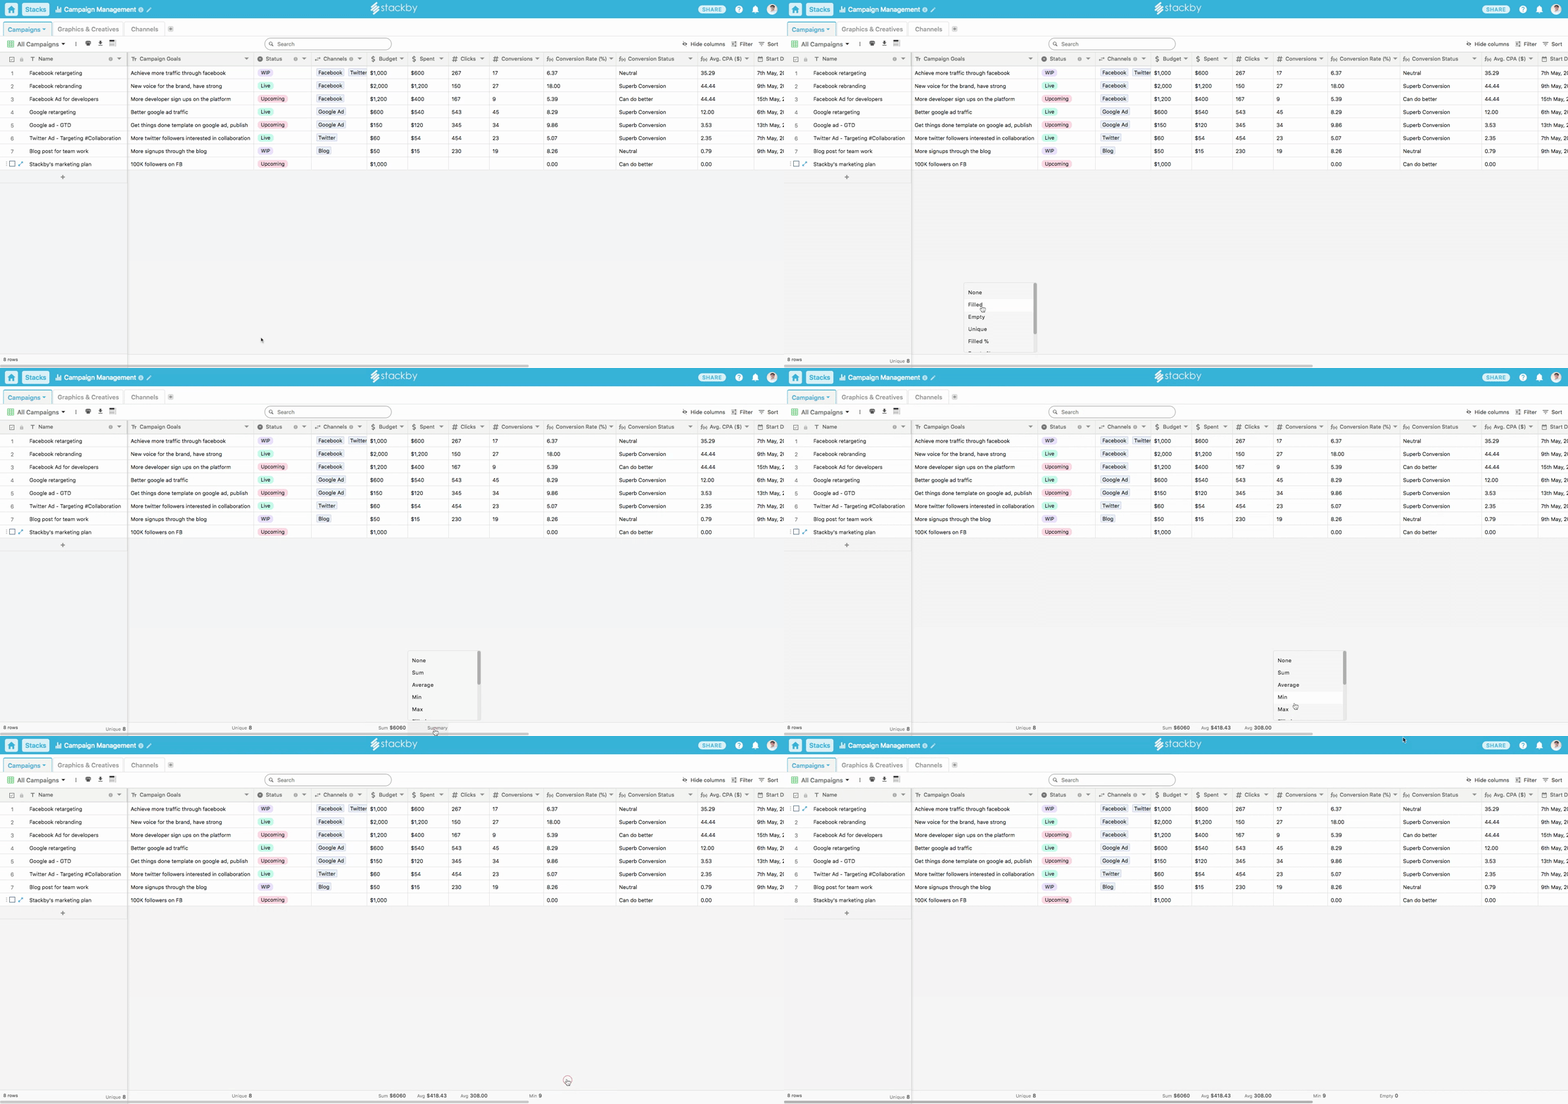
The summary bar displays summary of your table content.
In this article, we will take a look at:
Summary bar overview
How to view your summary on the summary bar
Summary functions available on Stackby
Summary bar overview
On Stackby, the summary bar information shows at the bottom of each column in the table/grid view. We know that not everyone needs to see the summary of their columns in the table so do not have any type of summary as a "default" function except for the number of rows on the bottom left. This means that you can choose the summary function of your choice from the menu.
How to view your summary on the summary bar
Because we don't have a default summary function, the bottom edge bar looks clean. To view or add a summary function, just hover your cursor near bottom edge of the column and the summary function button will show up. Click on that to select the summary that you need for that particular column.

Summary functions available on Stackby
We have general and specific summary functions available on Stackby. For most columns, you can select either of the below functions:
General available summary types
Empty%
This one shows you the percentage of empty cells in that particular column (or how many are yet to be filled in).
Unique%
This function calculates the percentage of unique values present in the column.
There, that are the general summary functions on Stackby.
But that is not all. We have a few more summary functions that are unique to a couple of column properties. These column properties are # Number Based, +1 Auto Number, Date and Time and Checkbox.
For Number based or Auto-number column type
When you select # Number Based or +1 Auto number as a column property, you get Sum, Average, Min, Max as extra summary functions (apart from None, Filled, Empty, Unique, Filled%, Empty%, Unique%).
Sum
As the name suggests, it gives you the average of all numerical values in the column.
Min
This function gives you smallest/lowest numerical value in the table.
Max
This function gives you the largest/highest numerical value in the table.
For Date and Time column type
When you select Date and Time as a column property, you get Earliest Date and Latest Date as extra summary functions (apart from None, Filled, Empty, Unique, Filled%, Empty%, Unique%).
Earliest Date
This function gives to the earliest/oldest date in the Date/time column.
Latest Date
This function gives the most recent date in the Date/time column.
For Checkbox Column type
When you select Checkbox as a column property, you get only Checked, Unchecked, Checked% and Unchecked% as summary functions (the general functions of None, Filled, Empty, Unique, Filled%, Empty%, Unique% functions are not available when you select Checkbox as a column property).
Checked
This function gives you the number of cells/check boxes which are ticked/checked off.
Unchecked
This function gives you the number of cells/check boxes which not ticked/checked off.
Checked%
This function gives you the percentage of cells/check boxes which are ticked/checked off.
Unchecked%
This function gives you the percentage of cells/check boxes which not ticked/checked off.


