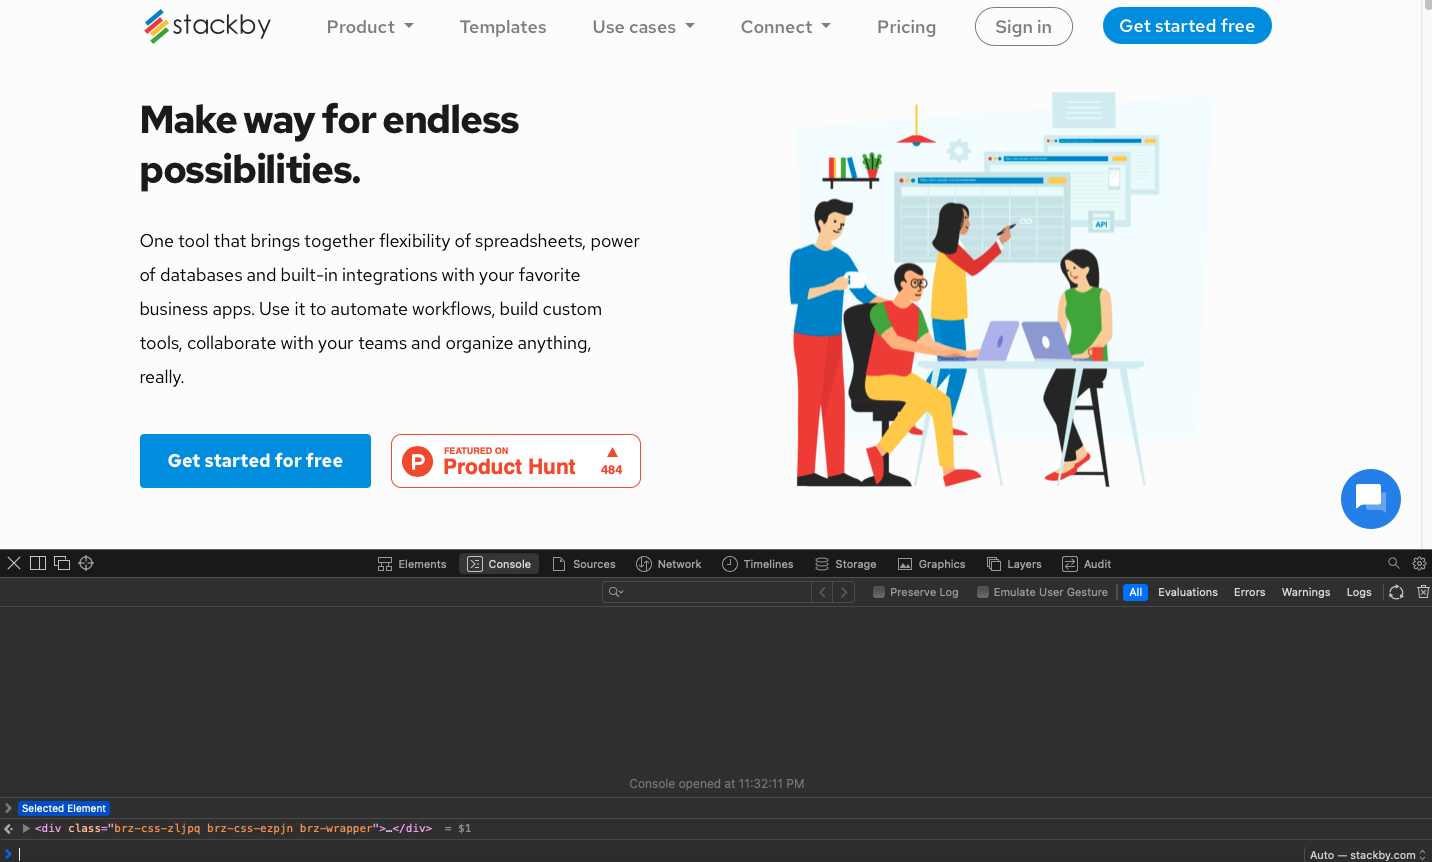
A developer console is a tool that logs information associated with web pages, such as javascript, network requests and security errors.
The information displayed in the Developer Console can be very helpful for the Stackby Support Team when we are trying to figure out to solve an issue. While solving the issue the Stackby Support Team may ask you to share the screenshot if the Developer Console.
To know how to open the developer console in different browsers. Please read the instruction mentioned below-
Chrome
To open the developer console window on Chrome, use the keyboard shortcut Ctrl+Shift+J (Windows) or Ctrl+Option+J (Mac)
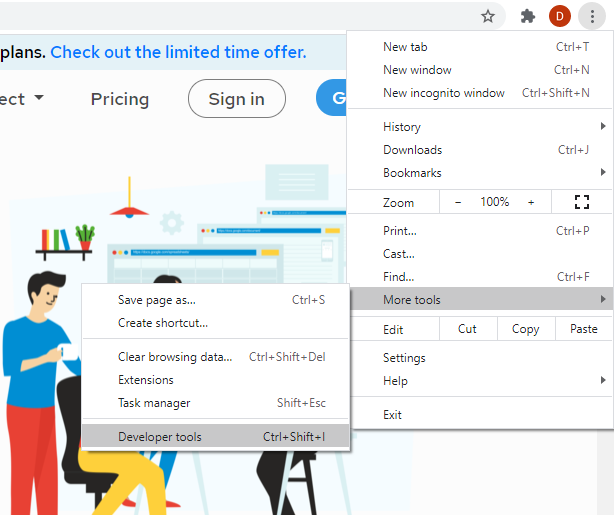
Or you can use the Chrome menu in the browser window, select the option - More Tools and then select - Developer Tools.
Edge
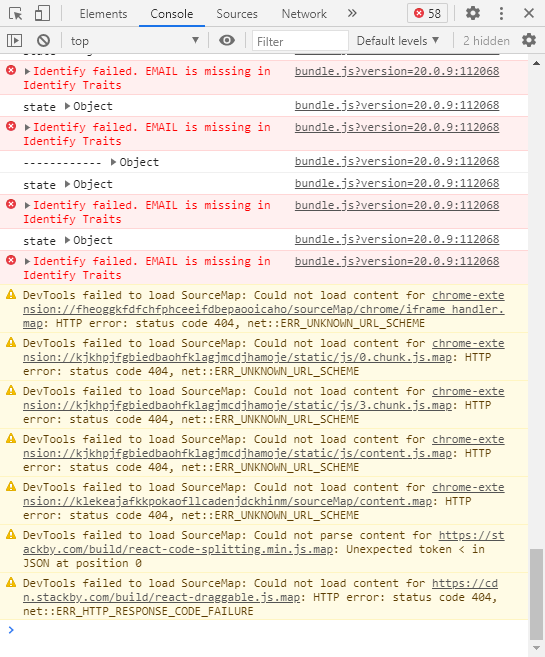
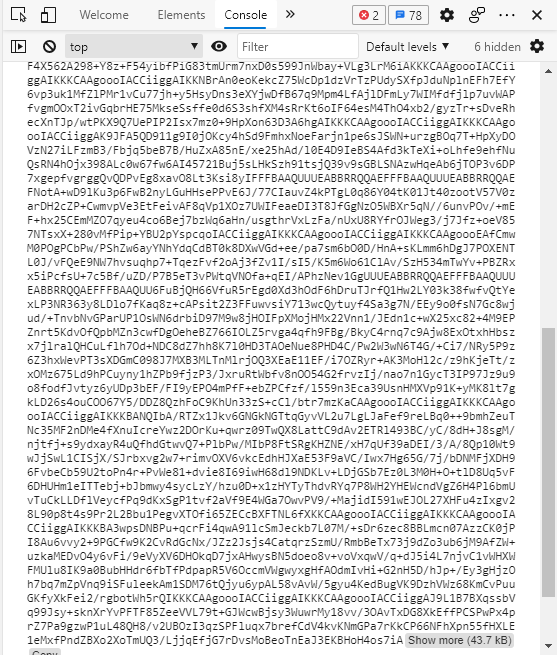
To open the Developer Console on Edge, press the F12 button. Once the developer console is open navigate to Console
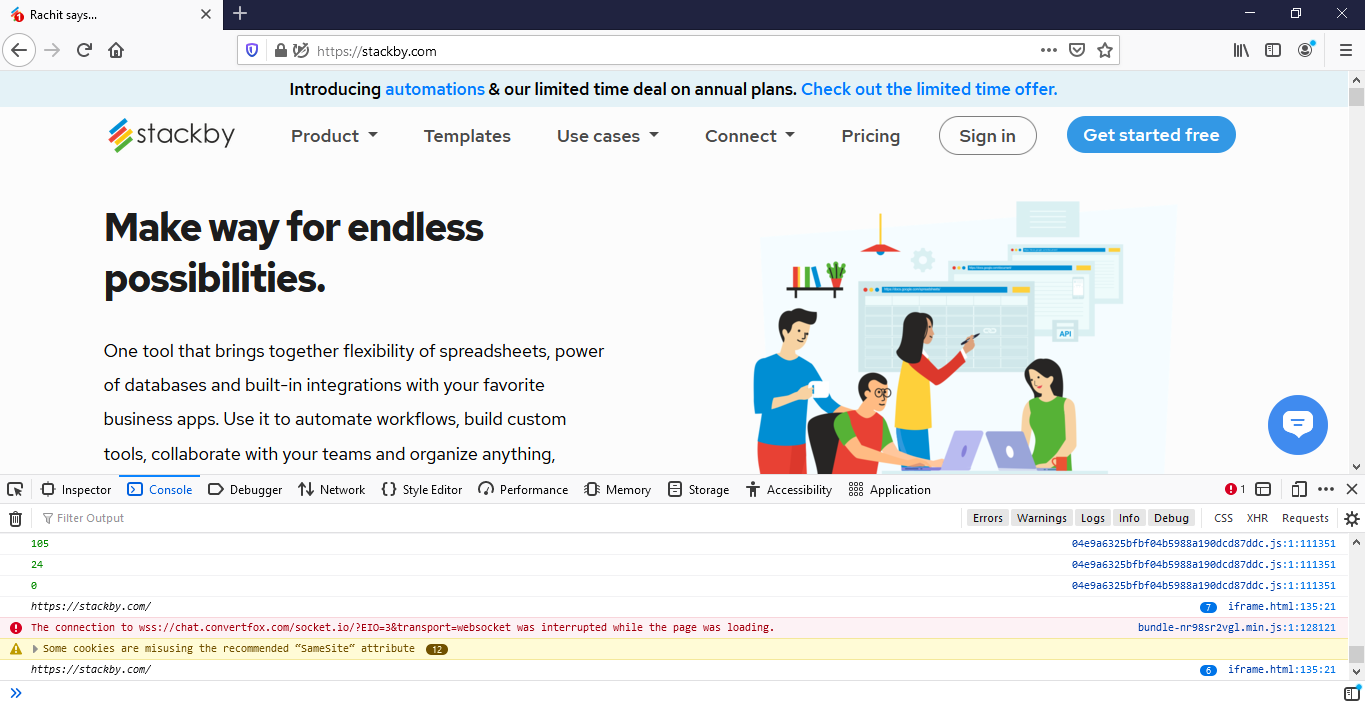
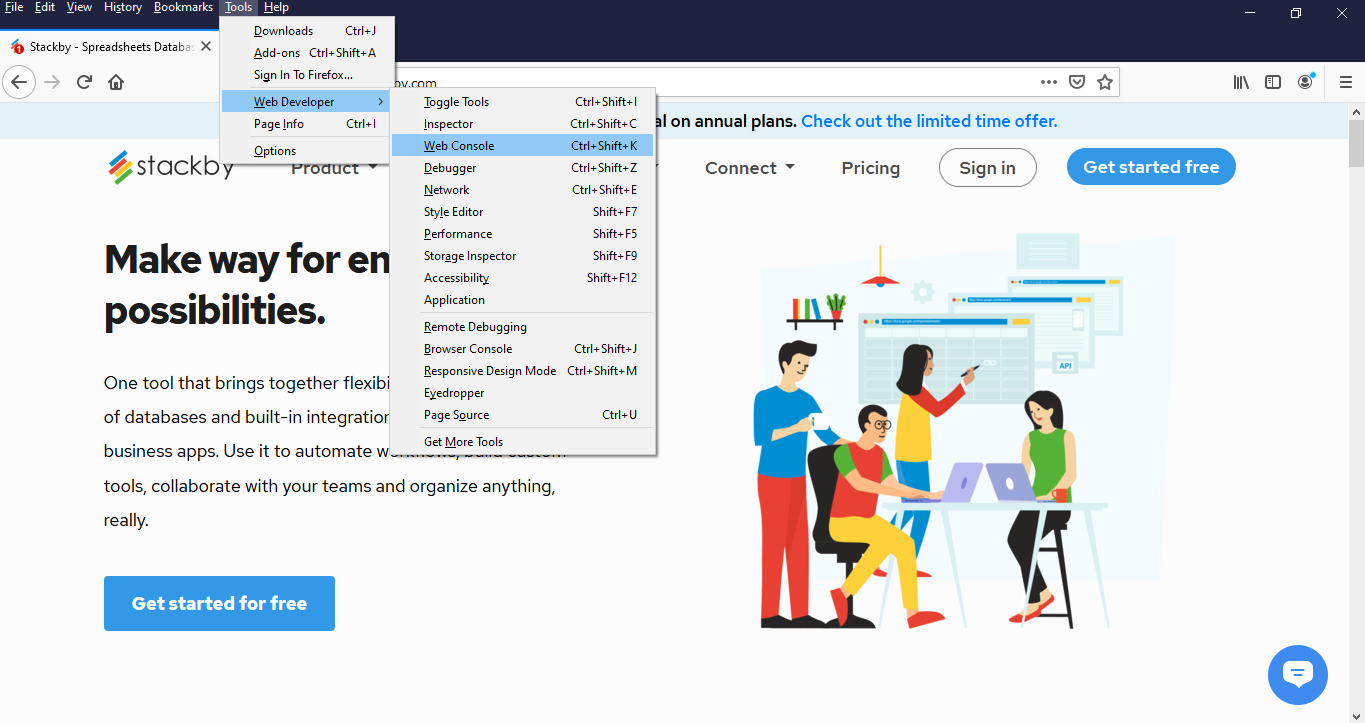
Firefox
To open the Developer Console on Firefox, use the keyboard shortcut Ctrl+Shift+K (Windows) or Ctrl+Option+K (Mac). The developer console will appear at the bottom of the screen when activated.
Or, under the header Tools in the Mac/Window menu bar, navigate to the sub-menu Web Developer and select Web Console.
Safari
To open the developer console on Safari, you will first need to turn on the Develop menu. To do this, open the Safari menu in the Mac menu bar, then select Preferences.
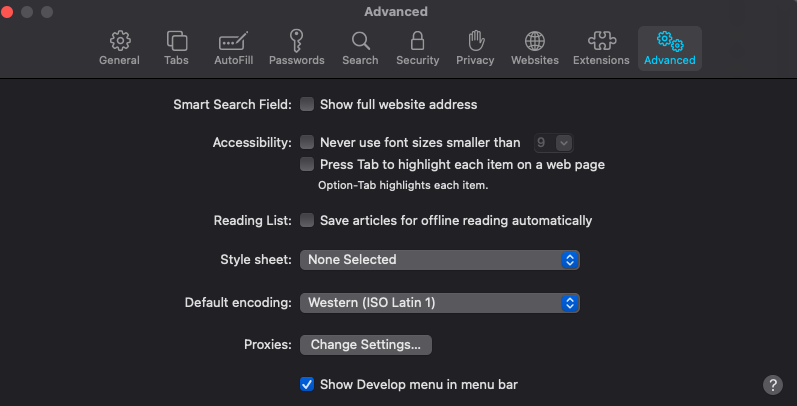
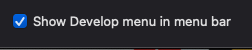
Once in the Preferences dialogue, navigate to the Advanced tab, then check the "Show Develop menu in the menu bar" box.
Once the Develop menu has been enabled, you can go to the Develop menu in the menu bar and then select the "Show JavaScript Console" option.
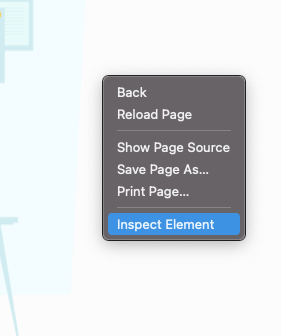
The JavaScript Console will show up on the bottom half of the active browser window. Right click and go to Inspect Element.
Or, you can use the keyboard shortcut Option+Ctrl+C, though note that you will need to enable the Develop menu in your Safari Preferences for this shortcut to work.