The Flowchart app in Stackby lets you visualize relationships and dependencies between records as a flowchart. It is useful for mapping processes, workflows, project steps, decision trees, and other connected data.
Open the Stack where you want to create a flowchart.
Open the table containing the records you want to visualize.
Add the Flowchart app,
For the flowchart to work correctly, your table should contain records that are connected to one another. For example, a Project Tasks table can link each task to its next or dependent task.
The flowchart app requires a stack with the following:
A table with a linked record field that links to records in that same table.
Only collaborators with editor access and above can configure the flowchart settings. Collaborators with commenter or read-only permissions can still view and export the chart.
Optional: color-coded records (if you want the flowchart to mirror the colors of your records).
The flowchart extension has three primary settings you'll need to adjust to get started:
Table: Choose the table you want to work with to build the flowchart. Make sure the table you choose has the linked record field that links to other records in this same table.
View: Choose any view in the table you selected in the previous setting. You can choose all records or a filtered view you've created that only displays a selection of records.
Linked-record field: Choose the linked record field in this table that links to other records in the same table. The flowchart extension will automatically build your flowchart from the contents of this field.
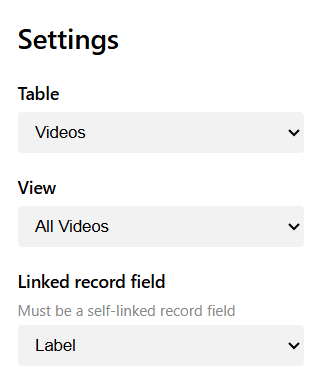
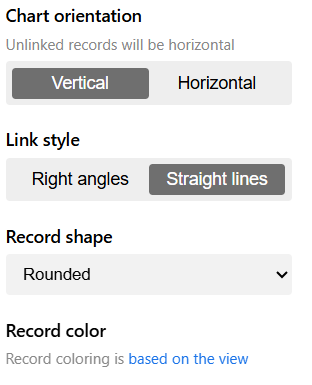
You can also adjust the flowchart layout and appearance using the available settings, such as:
Chart Orientation: Choose the direction in which your flowchart is displayed vertical or Horizontal.
Link style: Adjust how connections between records are displayed.
Record shape: Choose the shape used to represent records in the flowchart.
Record Color: The flowchart displays all records in white but you can change this by color-coding your records.
You can export your flowcharts as PNG and SVG files whenever you wish by clicking the corresponding export button at the bottom of the app.
What is the Flowchart app used for?
The Flowchart app helps you visually represent relationships and dependencies between records in a Stackby table.
How does the flowchart get created?
The flowchart is automatically generated from the relationships between records in the selected column.
Can I change the flowchart layout?
Yes. You can use the available settings to adjust the orientation, link style, and record shape.
Can I edit records directly from the flowchart?
Changes to the data should be made in the underlying Stackby table. The flowchart uses that data to generate the visualization.
Why are some records not appearing in the flowchart?
Check that the records are included in the selected view and that the relationship/linking information is correctly configured.
Does the flowchart update when I change my table?
Yes. Changes to the records and their relationships are reflected in the flowchart.