The VegaLite App brings advanced, fully customizable data visualizations to Stackby — letting you build any chart type using the Vega-Lite specification, connected to your live table data.
In this article
Overview
Availability
Adding a vega lite the App
Setting up a Vega-lite chart extension
Vega lite documentation and examples
FAQ
The VegaLite App is designed for data teams and analysts who need full control over how data is presented. Using Vega-Lite grammar, you can build complex, publication-quality charts that update automatically as your table data changes.
Available on: Economy, Business, and Enterprise plans
To add the Vega-Lite App to your Stack:
Open your Stackby workspace.
Open the Stack where you want to create visualizations.
Click on the + Add App button from the Apps section.
Search for Vega-Lite in the app gallery.
Select the Vega-Lite App from the available apps.
Click Add App to install it in your Stack.
1. Choose the table containing the data you want to visualize. The Vega-Lite App will automatically use records from the selected table as its data source.
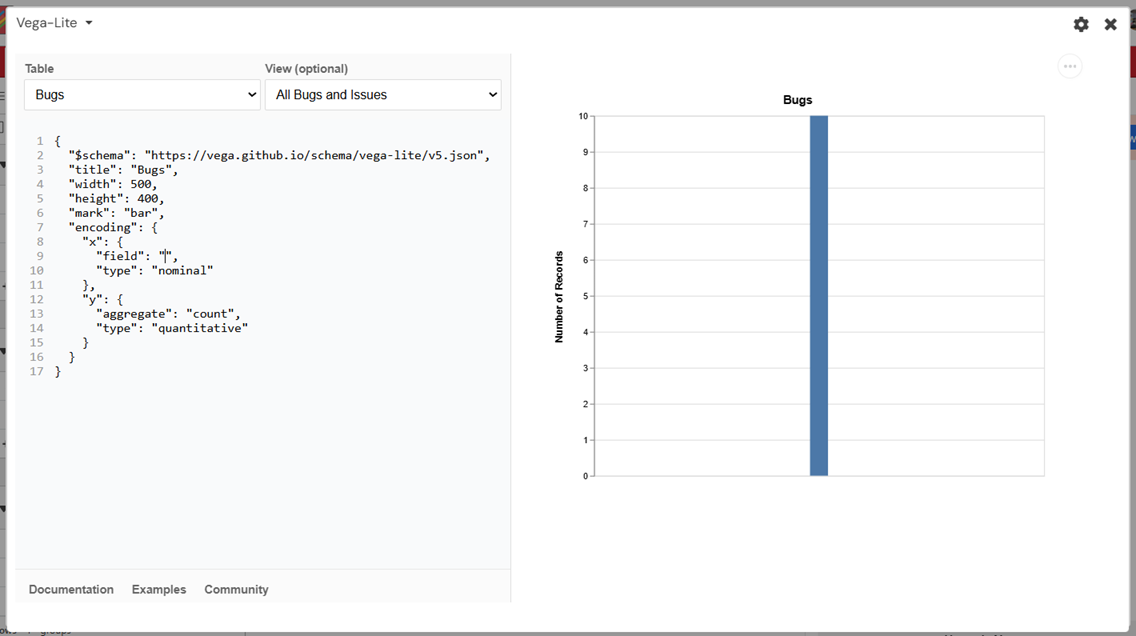
2. The Vega-Lite chart app is configured using JSON which appears in the left pane. When you select a table, the JSON for a bar chart is created automatically.
Note that the JSON created by default does NOT have a data property. This is because selecting the table adds that data property behind the scenes for you.
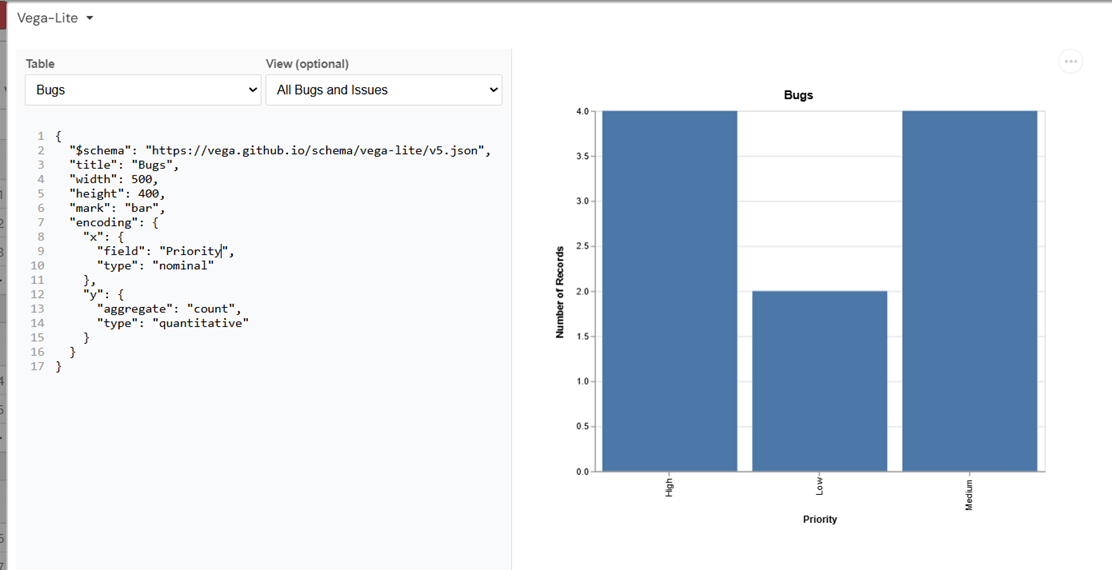
3. For this example, we will set the x-axis to show the different bug severity levels (Critical, High, Medium, Low) from a field that already exists in the table.
In the "x" property, the field references the Bug Severity field in the table, and the type is set to ordinal since bug severity levels follow a defined order of importance. For more information about field types, refer to the Vega-Lite type documentation.
You can type directly in the left pane to edit the JSON specification.
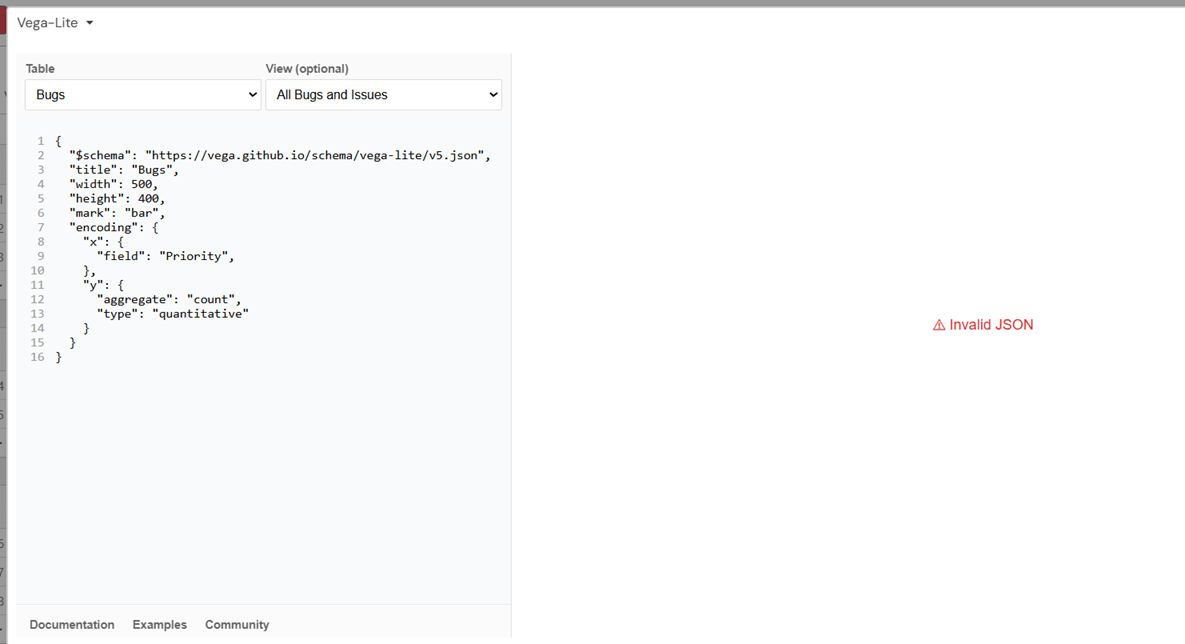
4. As you type, the right pane will either show a chart or will provide simple error descriptions if the configuration is not well-formed. For example, when you add a field without specifying a type, you will see an error message.
The Vega-Lite website has extensive tutorials, documentation, and examples to support simple to advanced charts. The following is a lightweight reference to parts of that documentation that can get you started the most quickly.
A chart can have multiple views which in Vega-lite means a specification for a single mark type (bar chart, scatter plot, line chart, etc.). The multiple views are managed with view composition.
Each mark type can have additional properties. For example, the bar chart has an orient property to change the direction of the bars from vertical to horizontal.
You could change the height and width of the chart but for the chart to fill the space it is best to leave the height and width set to "container".
You can control the colors in the chart by using the color property.
1.Are chart templates available?
Yes. Vega-Lite provides a large collection of examples and templates that can be adapted for use in Stackby.
2. Vega-Lite examples include a data property. What should I do?
You can remove the data property from most Vega-Lite examples.
Stackby automatically supplies data from the selected table, so manually defining the data source is usually unnecessary.
3. What does "container" mean for width and height?
When width and height are set to "container", the chart automatically adjusts to fill the available app space and remains responsive across screen sizes.
4. How do I reference Stackby columns?
Use the exact column name as the field value.
Example:
{
"field": "Project Status"
}
5. Why is my chart not displaying?
Verify that:
JSON syntax is valid.
Column names match exactly.
The selected table contains records.
The correct data types are being used.