
The VegaLite App brings advanced, custom data visualizations to Stackby — letting you build charts and graphs beyond what standard views offer.
What it does
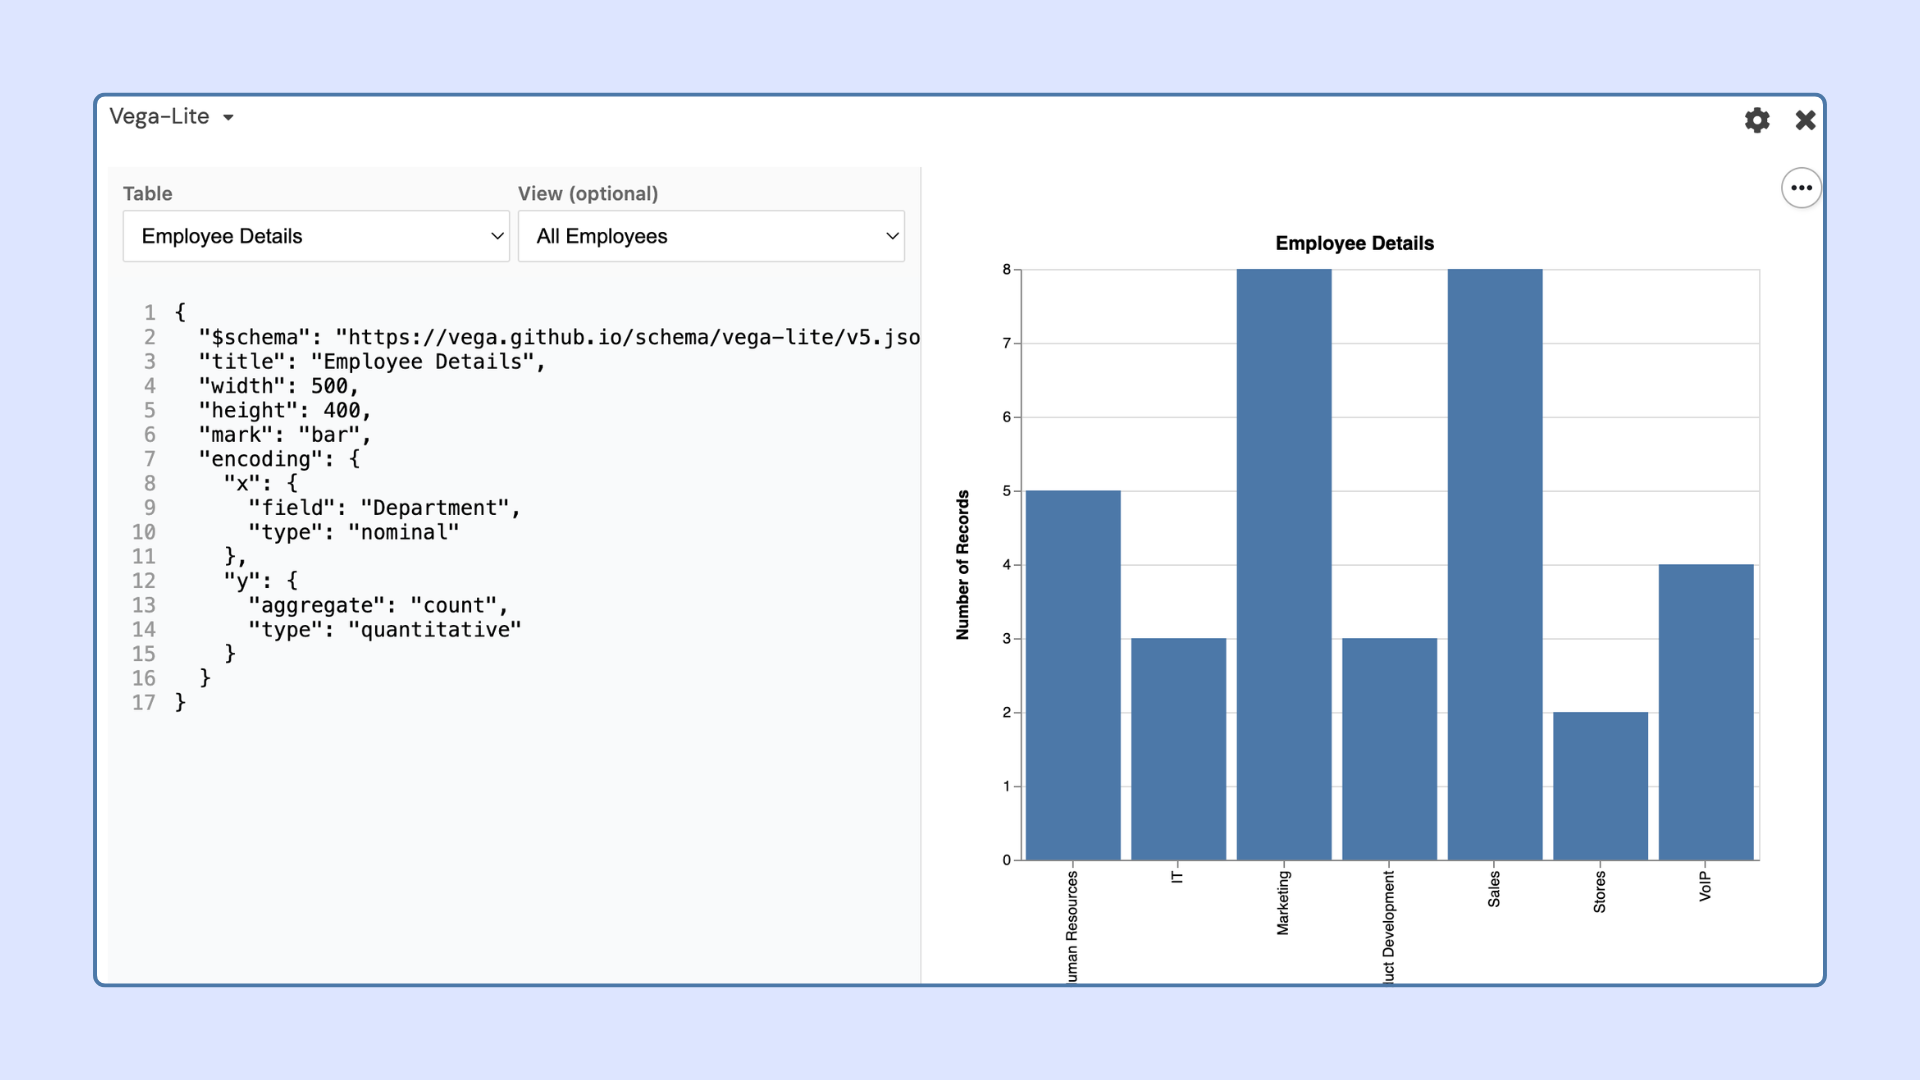
Use the Vega-Lite specification language to create rich, customizable charts
Supports bar charts, line charts, scatter plots, heatmaps, area charts, and more
Data is pulled live from your Stackby tables
Embed visualizations directly in your Stack views
Why it matters
Standard charts cover most use cases, but data teams often need more control. VegaLite opens up a powerful visualization layer for analysts and advanced users who want pixel-perfect, publication-ready charts.