The Summary App is used to display the number of rows in a given view or apply a summary function to the rows so you can see the Total Count, Count Unique, and Percent Unique.
The summary app shows a summarization of a particular column.
It displays the number of rows in a given view which is useful for drawing attention to particular numerical values.
Also can add a color and custom label for a particular column.
You can apply a summary function to the rows so you can see the Count filled, Percent Empty, sum, average, minimum, or maximum value of a column in a view.
Step 1:
To Add a Summary App to your stack, add it from the app dashboard. Click on Apps.
Click the Add an app button that appears. You can add the Summary App in 2 ways.
From the Dashboard click on + Add an App
Click on Add an App button
Now dialog box is displayed, select Summary App and then click on Add App button.
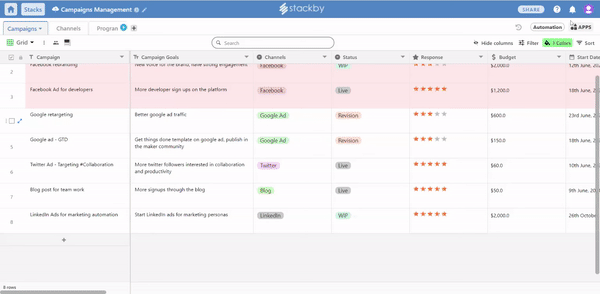
Step 2:
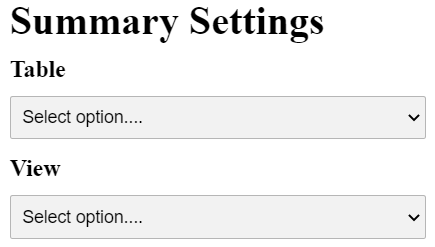
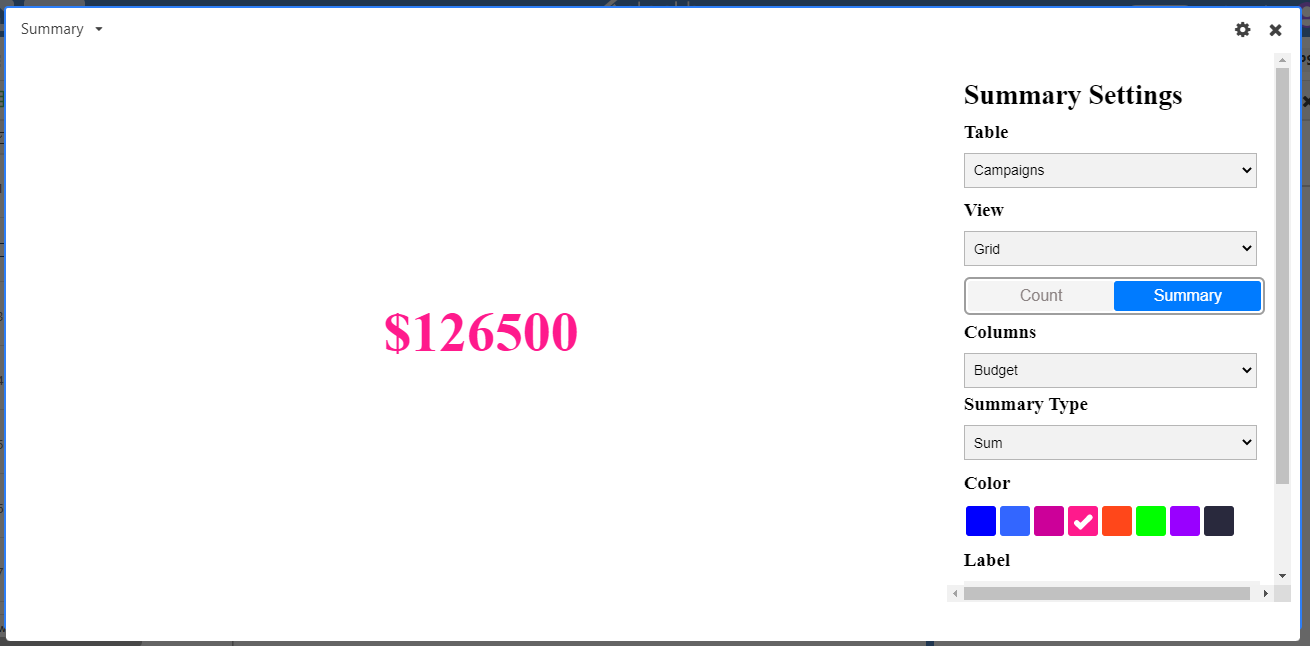
Select the table name and view from the dropdown list for the information you want to summarize
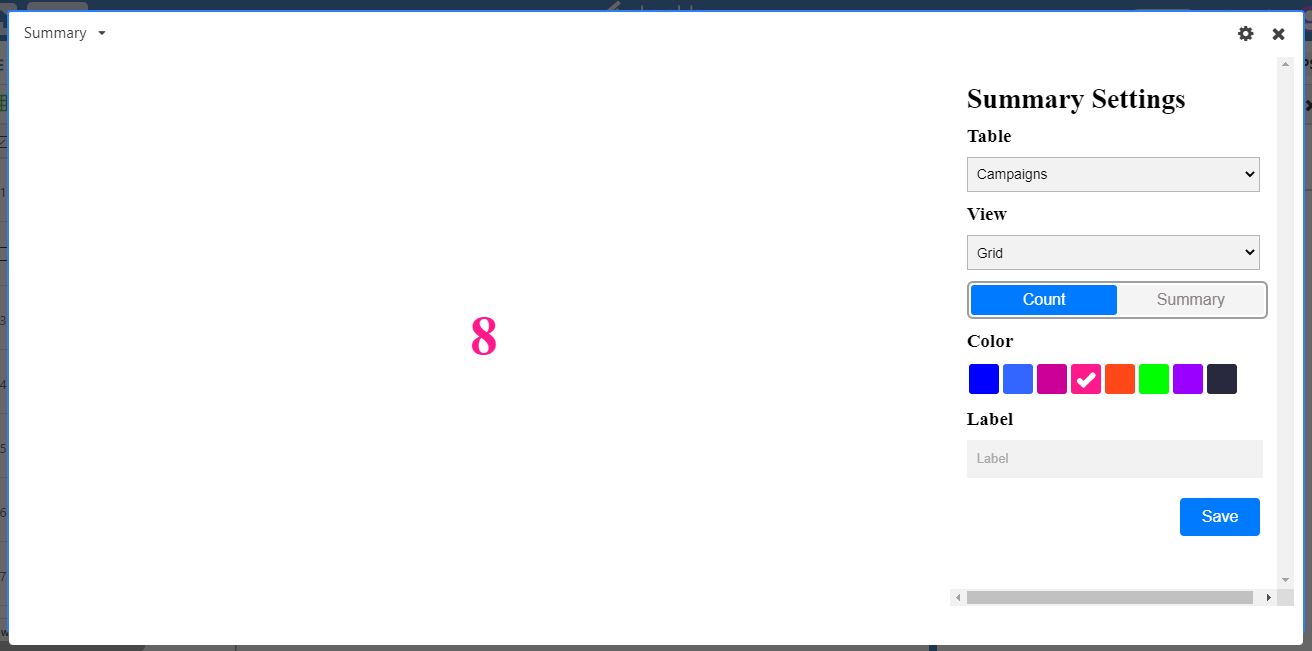
In Summary App, the app is displayed in Count form or in Summary form.
It simply displays the number of rows that are visible in the view you specify.
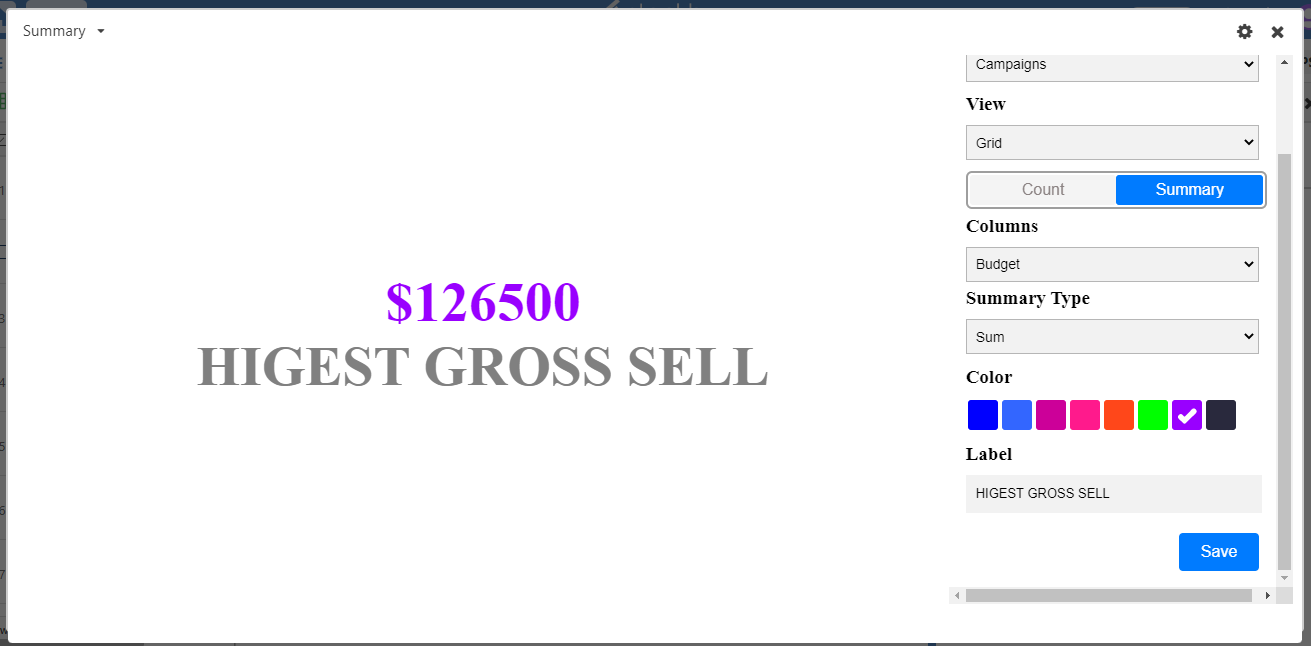
It displays the result of a summary function performed on a specific Column.
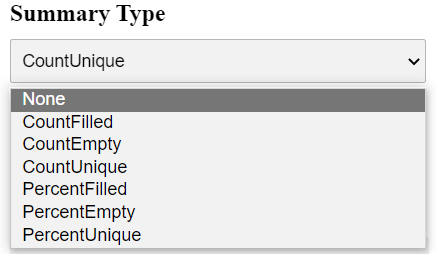
After selecting a summary form, you'll need to select a column, and a type of summary function, like Count filled, Percent Empty, Sum, Avg, Min, or Max.
In Summary Type, you can summarize values based on:
- Count Filled: It will count the total No. of columns Filled,
- Count Empty: It will count the total No. of Empty columns,
- Count Unique: It will count unique no. of columns,
- Percent Filled: It's the same as Count filled but will display the result in %,
- Percent Empty: It will show you the Empty columns in Percent Format,
- Percent Unique: It will display unique columns in Percent Format.
Once you've set up your count or summary number, you can customize it by selecting one of your favorite colors from the list, and giving it a meaningful label.
