A pivot table is a summary tool that wraps up or summarizes information sourced from bigger tables.
Setting up a pivot table
First, install the pivot table app.
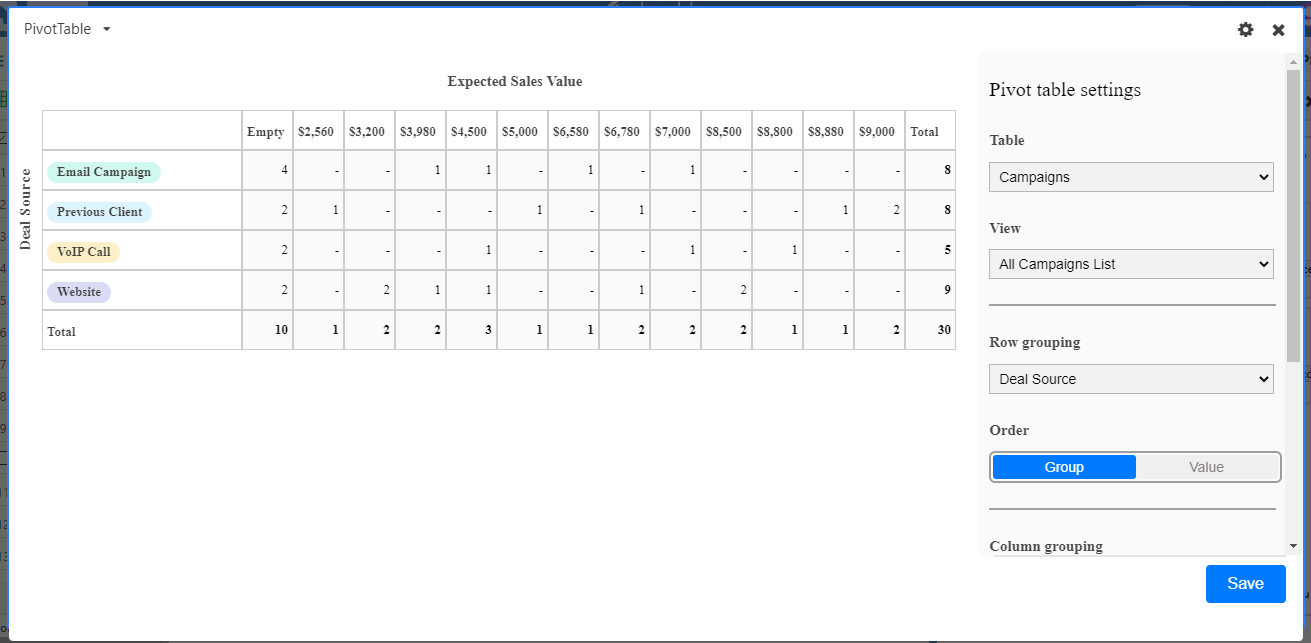
Once installed, the app will open up to fill your screen. By default, the app will automatically select the most recent table and view in which you were working, even you can change the table name and view as desired.
Note that while a row grouping is required to build a pivot table, a column grouping is not required. If you select None as the column grouping option, then there will be no column grouping, and the summary function will just apply to the row groups. 
Sorting
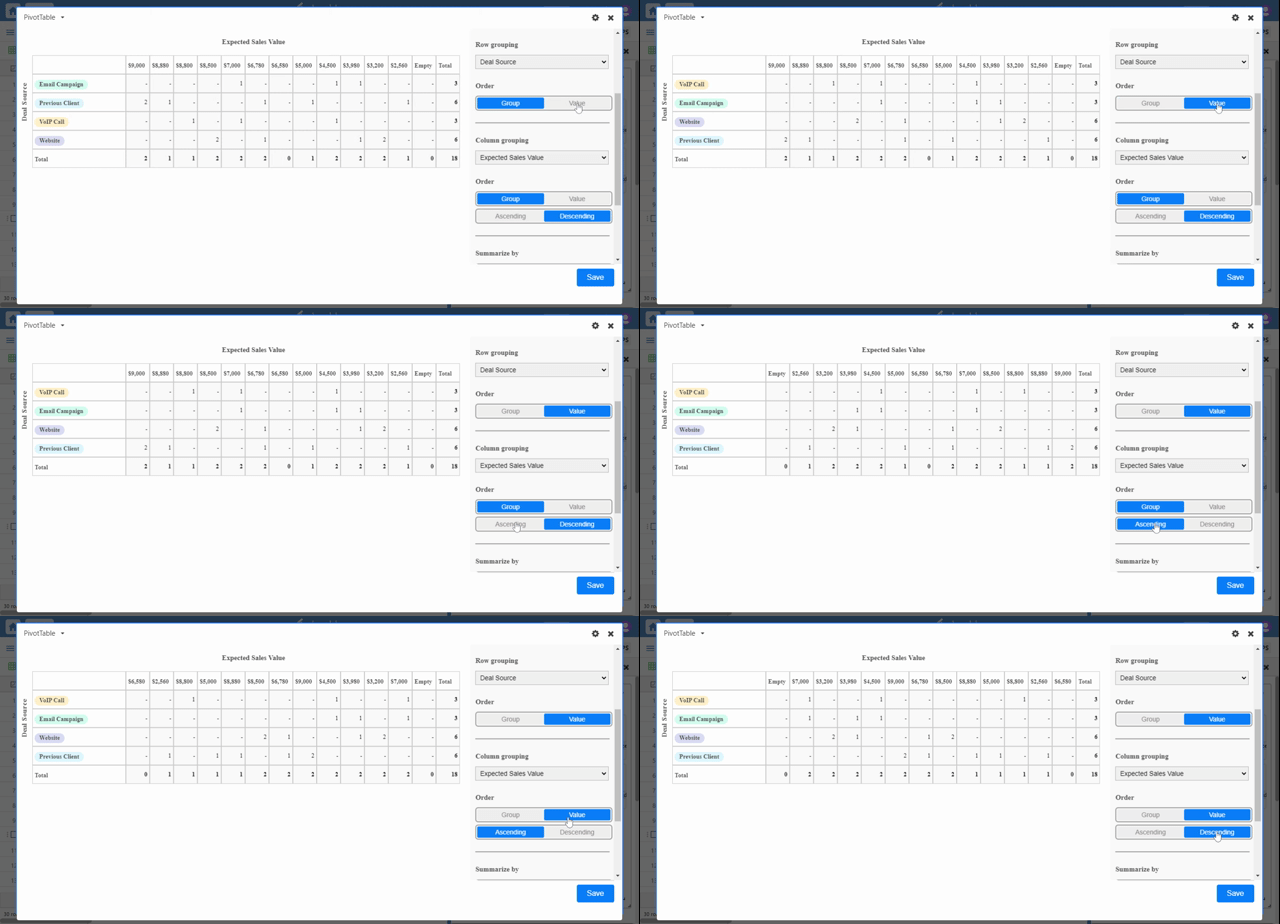
Both rows and columns can be sorted within the pivot table app using one of the following:
Group: The values in the column that make up the headings of the rows and columns (numerical order for number types, alphabetical order for text)
Value: Row/column summary values (ie count filled, percent filled , etc)
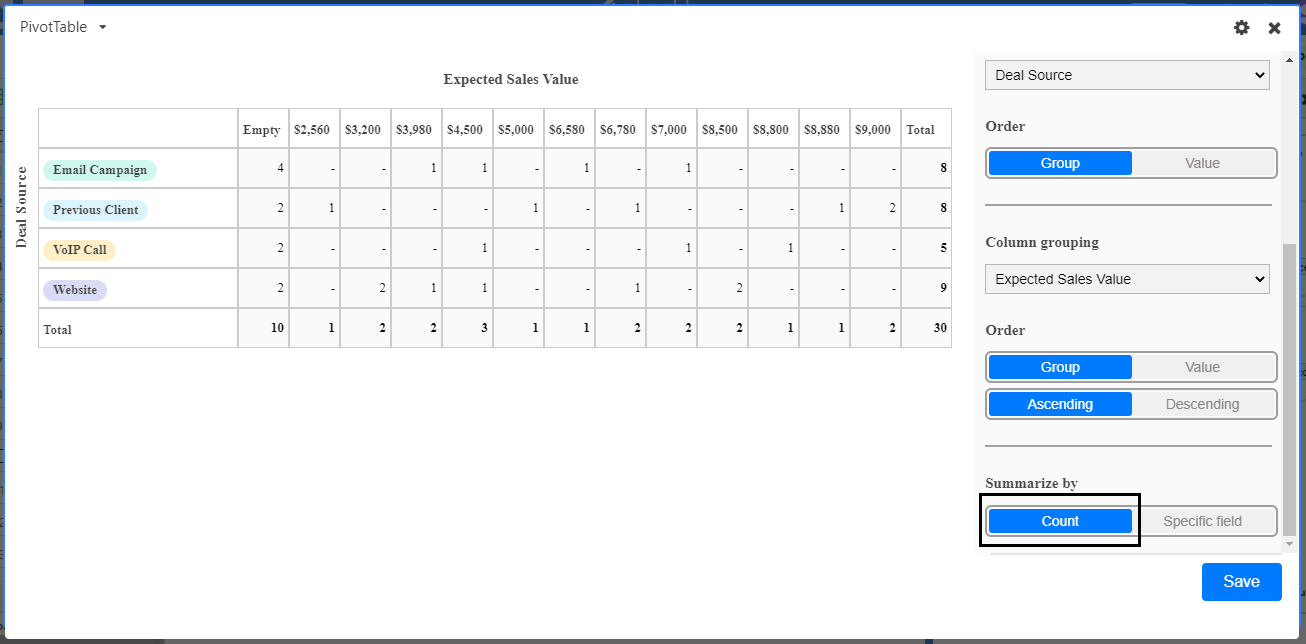
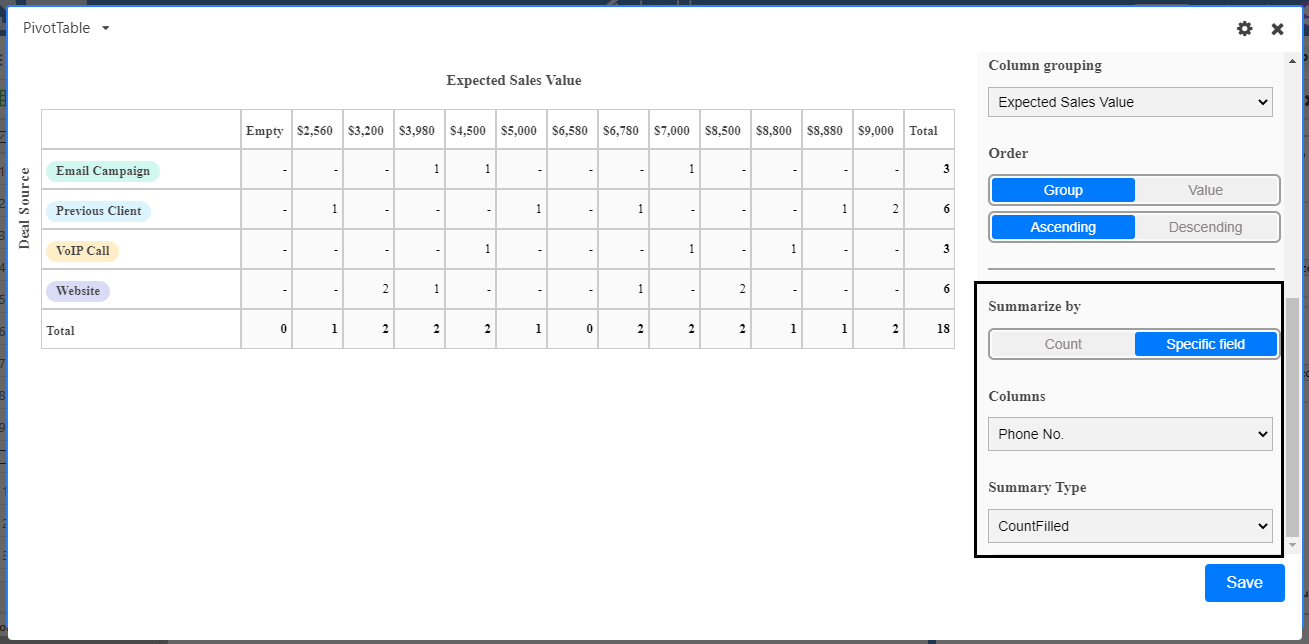
Once you’ve picked a row and/or column groupings, you can choose to summarize the data by Count or by a Specific column.
1. Count simply displays the number of rows that are included in the row and column grouping. 2. Specific field displays the results of a summary function performed on a specific column. If you pick a specific field, you'll need to select the column from the drop down menu, and a type of summary function, like count field, count empty etc. The available summary functions will depend on the column type.


